Introduction to Monte Carlo Simulation and Sensitivity Analysis
In the world of mathematical modeling and decision-making, two powerful tools stand out: Monte Carlo Simulation and Sensitivity Analysis. Both techniques are used to analyze the behavior of complex systems and to assess the impact of uncertainties on the outcomes. However, despite their similarities, Monte Carlo Simulation and Sensitivity Analysis serve different purposes and employ distinct methodologies.
What is Monte Carlo Simulation?
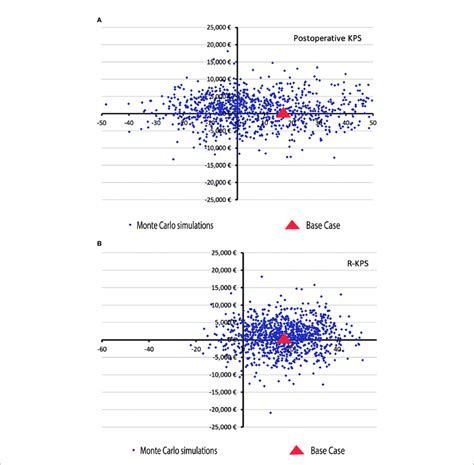
Monte Carlo Simulation is a computational technique that relies on repeated random sampling to obtain numerical results. It is named after the famous casino in Monaco, as the method resembles the games of chance played there. The main idea behind Monte Carlo Simulation is to create a model of a system with uncertain inputs, and then run the model numerous times, each time using different randomly selected values for the uncertain parameters. By doing so, the simulation generates a distribution of possible outcomes, allowing decision-makers to assess the likelihood of different scenarios.
What is Sensitivity Analysis?
Sensitivity Analysis, on the other hand, is a technique used to determine how changes in the input variables of a model affect the output. It helps identify which input parameters have the greatest impact on the model’s results and how sensitive the model is to variations in those parameters. Sensitivity Analysis can be performed using various methods, such as one-factor-at-a-time (OFAT) analysis, where each input variable is changed individually while keeping others constant, or global sensitivity analysis, which considers the interactions between input variables.
Key Differences between Monte Carlo Simulation and Sensitivity Analysis
While both Monte Carlo Simulation and Sensitivity Analysis deal with uncertainties in mathematical models, they differ in several key aspects:
Purpose
- Monte Carlo Simulation: The primary purpose of Monte Carlo Simulation is to quantify the uncertainty in the model’s output by generating a distribution of possible outcomes based on the uncertainties in the input parameters.
- Sensitivity Analysis: The main goal of Sensitivity Analysis is to identify the input variables that have the most significant impact on the model’s output and to understand how changes in these variables affect the results.
Methodology
- Monte Carlo Simulation: Monte Carlo Simulation involves running the model multiple times, each time using a different set of randomly selected input values. The input values are sampled from probability distributions that represent the uncertainties in the parameters.
- Sensitivity Analysis: Sensitivity Analysis systematically varies the input variables, either one at a time (OFAT) or in combination (global sensitivity analysis), to observe how the changes influence the model’s output. It does not necessarily involve random sampling.
Output
- Monte Carlo Simulation: The output of a Monte Carlo Simulation is a distribution of possible outcomes, which can be used to calculate statistics such as the mean, median, and standard deviation of the results, as well as the probability of specific events occurring.
- Sensitivity Analysis: The output of a Sensitivity Analysis is typically a set of sensitivity measures, such as correlation coefficients or standardized regression coefficients, which indicate the strength and direction of the relationship between each input variable and the model’s output.

Applications of Monte Carlo Simulation and Sensitivity Analysis
Both Monte Carlo Simulation and Sensitivity Analysis find applications in various fields, including finance, engineering, physics, and environmental science. Some common applications include:
Monte Carlo Simulation Applications
- Financial risk assessment: Monte Carlo Simulation is widely used in finance to evaluate the risk associated with investment portfolios, project profitability, and option pricing.
- Project management: Monte Carlo Simulation can help project managers assess the likelihood of completing a project within a given time frame and budget, considering uncertainties in task durations and costs.
- Environmental modeling: Monte Carlo Simulation is used to model the transport and fate of pollutants in the environment, taking into account uncertainties in factors such as weather conditions and chemical reaction rates.
Sensitivity Analysis Applications
- Model validation: Sensitivity Analysis can be used to validate the assumptions and structure of a mathematical model by checking if the model’s behavior is consistent with the expected relationships between input variables and output.
- Parameter prioritization: Sensitivity Analysis helps identify the most influential input parameters, allowing researchers to focus their efforts on collecting more accurate data for these variables or designing experiments to better understand their effects.
- Decision-making: Sensitivity Analysis can inform decision-makers about the robustness of a model’s results to changes in the input variables, helping them make more informed choices based on the range of possible outcomes.

Comparing Monte Carlo Simulation and Sensitivity Analysis
While Monte Carlo Simulation and Sensitivity Analysis serve different purposes, they can be used in combination to gain a more comprehensive understanding of a model’s behavior and the uncertainties involved. The table below summarizes the key differences between the two techniques:
| Feature | Monte Carlo Simulation | Sensitivity Analysis |
|---|---|---|
| Purpose | Quantify uncertainty in model output | Identify influential input variables |
| Methodology | Random sampling of input values | Systematic variation of input variables |
| Output | Distribution of possible outcomes | Sensitivity measures (e.g., correlation coefficients) |
| Uncertainty representation | Probability distributions for input variables | Range of values for input variables |
| Computational requirements | Often requires a large number of model runs | Can be performed with fewer model runs |

Advantages and Disadvantages of Monte Carlo Simulation and Sensitivity Analysis
Both Monte Carlo Simulation and Sensitivity Analysis have their strengths and limitations, which should be considered when deciding which technique to use for a particular problem.
Advantages of Monte Carlo Simulation
- Handles complex systems: Monte Carlo Simulation can be applied to models with a large number of uncertain input variables and complex interactions between them.
- Provides a full distribution of outcomes: The output of a Monte Carlo Simulation is a distribution of possible results, which gives decision-makers a more complete picture of the uncertainties involved.
- Incorporates correlations between input variables: Monte Carlo Simulation can account for correlations between input variables by using appropriate sampling techniques, such as copulas.
Disadvantages of Monte Carlo Simulation
- Computationally intensive: Monte Carlo Simulation often requires a large number of model runs to obtain reliable results, which can be time-consuming and computationally expensive.
- Depends on the quality of input distributions: The accuracy of the results depends on the quality of the probability distributions used to represent the uncertainties in the input variables. If these distributions are not well-defined, the results may be misleading.
- Interpreting results may be challenging: The output of a Monte Carlo Simulation can be difficult to interpret, especially for non-technical stakeholders, as it involves probability distributions and statistical measures.
Advantages of Sensitivity Analysis
- Identifies key drivers of model behavior: Sensitivity Analysis helps pinpoint the input variables that have the greatest impact on the model’s output, allowing researchers to focus their efforts on understanding and managing these variables.
- Provides insights into model structure: By examining how the model’s output responds to changes in the input variables, Sensitivity Analysis can reveal the underlying relationships and assumptions in the model.
- Computationally efficient: Sensitivity Analysis can often be performed with fewer model runs than Monte Carlo Simulation, making it less computationally intensive.
Disadvantages of Sensitivity Analysis
- Limited representation of uncertainty: Sensitivity Analysis typically uses a range of values for each input variable, rather than full probability distributions, which may not fully capture the uncertainties involved.
- Interactions between input variables may be overlooked: Some Sensitivity Analysis methods, such as OFAT analysis, do not account for interactions between input variables, which can lead to an incomplete understanding of the model’s behavior.
- Results may be sensitive to the chosen range of input values: The results of a Sensitivity Analysis can be influenced by the range of values chosen for each input variable. If the ranges are not representative of the real-world uncertainties, the results may be misleading.
Best Practices for Applying Monte Carlo Simulation and Sensitivity Analysis
To ensure the effective application of Monte Carlo Simulation and Sensitivity Analysis, consider the following best practices:
- Clearly define the model’s objectives and scope: Before applying either technique, it is essential to have a clear understanding of the model’s purpose, the decision-making context, and the key uncertainties involved.
- Choose appropriate input distributions or ranges: When performing Monte Carlo Simulation, select probability distributions that accurately represent the uncertainties in the input variables. For Sensitivity Analysis, choose input ranges that cover the plausible values for each variable.
- Use appropriate sampling techniques: In Monte Carlo Simulation, use sampling techniques that are suitable for the problem at hand, such as Latin Hypercube Sampling or Quasi-Monte Carlo methods, to ensure efficient and representative sampling of the input space.
- Validate the model: Before applying Monte Carlo Simulation or Sensitivity Analysis, validate the model’s structure and assumptions to ensure that it provides a reasonable representation of the real-world system being studied.
- Interpret results in the context of the decision-making problem: When presenting the results of a Monte Carlo Simulation or Sensitivity Analysis, focus on the implications for the specific decision-making problem, rather than just reporting the technical details of the analysis.
- Use visualization techniques: Employ clear and informative visualization techniques, such as histograms, scatter plots, or tornado diagrams, to communicate the results of the analysis to stakeholders effectively.
- Consider using both techniques: When appropriate, use both Monte Carlo Simulation and Sensitivity Analysis to gain a more comprehensive understanding of the model’s behavior and the uncertainties involved.
Frequently Asked Questions (FAQ)
-
Q: When should I use Monte Carlo Simulation instead of Sensitivity Analysis, or vice versa?
A: Use Monte Carlo Simulation when you need to quantify the uncertainty in the model’s output and generate a distribution of possible outcomes. Use Sensitivity Analysis when you want to identify the input variables that have the greatest impact on the model’s output and understand how changes in these variables affect the results. -
Q: Can I use Monte Carlo Simulation and Sensitivity Analysis together?
A: Yes, you can use both techniques in combination to gain a more comprehensive understanding of the model’s behavior and the uncertainties involved. For example, you can use Sensitivity Analysis to identify the most influential input variables and then focus your Monte Carlo Simulation efforts on these variables to quantify the uncertainty in the model’s output. -
Q: How many model runs do I need for Monte Carlo Simulation and Sensitivity Analysis?
A: The number of model runs required depends on the complexity of the model and the desired level of accuracy. For Monte Carlo Simulation, a common rule of thumb is to use at least 10,000 runs to obtain reliable results. For Sensitivity Analysis, the number of runs depends on the chosen method and the number of input variables. One-factor-at-a-time (OFAT) analysis typically requires fewer runs than global sensitivity analysis methods. -
Q: What are some common probability distributions used in Monte Carlo Simulation?
A: Some common probability distributions used in Monte Carlo Simulation include: - Normal (Gaussian) distribution: Used for variables that are symmetrically distributed around a mean value.
- Uniform distribution: Used when all values within a range are equally likely.
- Triangular distribution: Used when the minimum, most likely, and maximum values are known.
-
Lognormal distribution: Used for variables that are positively skewed and have a long right tail.
-
Q: What are some global sensitivity analysis methods?
A: Some common global sensitivity analysis methods include: - Variance-based methods (e.g., Sobol’ indices): Decompose the variance of the model’s output into contributions from each input variable and their interactions.
- Regression-based methods (e.g., Standardized Regression Coefficients): Fit a linear regression model to the model’s output and use the coefficients to measure the influence of each input variable.
- Screening methods (e.g., Morris method): Identify the most influential input variables using a relatively small number of model runs.
Conclusion
Monte Carlo Simulation and Sensitivity Analysis are two powerful techniques for analyzing the behavior of mathematical models and assessing the impact of uncertainties on the outcomes. While both methods deal with uncertainties, they serve different purposes and employ distinct methodologies.
Monte Carlo Simulation is used to quantify the uncertainty in the model’s output by generating a distribution of possible outcomes based on the uncertainties in the input parameters. It involves running the model multiple times, each time using a different set of randomly selected input values sampled from probability distributions.
Sensitivity Analysis, on the other hand, is used to identify the input variables that have the most significant impact on the model’s output and to understand how changes in these variables affect the results. It systematically varies the input variables, either one at a time or in combination, to observe how the changes influence the model’s output.
Both techniques find applications in various fields, such as finance, engineering, and environmental science. They can be used separately or in combination to gain a more comprehensive understanding of a model’s behavior and the uncertainties involved.
When applying Monte Carlo Simulation or Sensitivity Analysis, it is essential to follow best practices, such as clearly defining the model’s objectives, choosing appropriate input distributions or ranges, validating the model, and interpreting the results in the context of the decision-making problem.
By understanding the differences between Monte Carlo Simulation and Sensitivity Analysis, and applying them appropriately, decision-makers can gain valuable insights into the uncertainties surrounding their models and make more informed choices based on the range of possible outcomes.

Leave a Reply